Introduction
The cell cycle is the process where a cell (whether eukaryotic or prokaryotic) divides into two daughter cells. In eukaryotic cells the cell cycle consists of interphase and mitosis, which can be split into the following phases:
- Rest stage: G0, cell is not dividing
- Interphase: cell accumulates nutrients, produces proteins/organelles
- G1 (gap one) cell growth
- S (synthesis) DNA synthesis and chromosome replication
- G2 (gap two or growth) cell growth, preparation for mitosis
- Mitosis (M): chromosomes and organelles separated into two daughter cells
- Prophase: chromosomes condense, mitotic spindles form, centrosomes go to opposite edges of cell
- Prometaphase: nuclear envelope disintegrates, spindles bind chromosomes to centromeres
- Metaphase: centrosomes pull chromosomes to centre of cell
- Anaphase: chromosomes split and are pulled apart to opposite ends of cell
- Telophase: cell elongates, new nuclei form, chromosomes relax
- Cytokinesis: cleavage furrow forms and pinches cell into two identical daughter cells
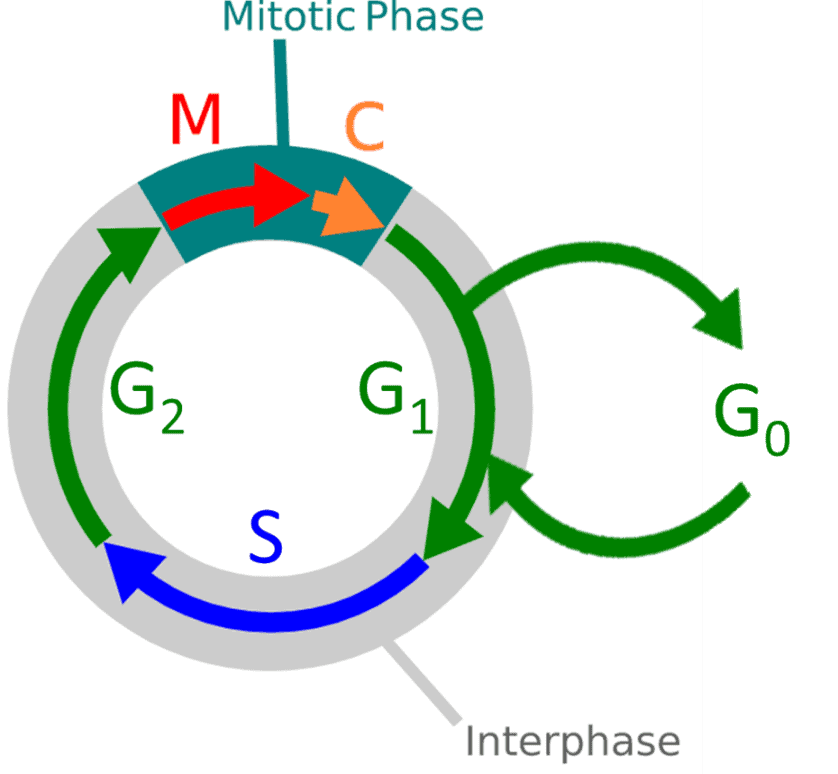
Once cytokinesis (and the mitosis phase as a whole) ends the cell either enters G0 rest state or enters interphase for a new cell cycle division process. This whole process can be displayed as a cycle, as seen in Fig.1

Figure 1. Diagram of the cell cycle stages. M: mitosis, C: cytokinesis, G0: rest phase, G1: gap one, S: synthesis, G2: gap two or growth. Overall stages are mitosis and interphase.
The cell cycle is a tightly regulated process that is vital for cell proliferation/differentiation and can be modified in certain disease states. Disrupting this regulation can lead to tumor formation and cancer, making the cell cycle a key target for drug discovery and for research into cancer (and anti-cancer therapies), cell biology (and in vitro culture) and regenerative medicine (due to the role of the cycle in differentiation).
As well as needing assays to analyze cell cycle progress and position across whole cell populations, further tests are needed to detect cell cycle dysfunction, whether genetic or pathological.
Cell Cycle Analysis Assays
DNA content
The amount of DNA in a cell changes through G1, S (doubling of DNA), G2 and M phases, so quantifying DNA content in a cell identifies its current cycle phase. Fluorescent DNA probes such as DAPI, Hoechst or propidium iodide are typically used in combination with flow cytometry, FACS or high content fluorescence microscopy, the more intense the signal the greater the DNA content. By plotting results on a histogram, it is clear what proportion of cells are at what phase, and if DNA damage or tumorigenesis are present. RNA-binding markers such as pyronin Y are used to separate G1 and G0 as the latter has lower rates of transcription.
Senescence
Cells can only divide so many times, known as the Hayflick limit. Upon reaching this limit cells are senescent (old), they do not divide or die (via apoptosis) but remain metabolically active and undergo various changes. These cells have greater expression of β-galactosidase, which can be detected using colorimetry with X-gal or via fluorescent probes.
Live cell imaging
Cell morphology, division, and even sub-cellular chromosome location can all be detected using a suitable high-resolution microscopy system. As cells can’t be fixed, fluorescent proteins are typically used to tag cells for live imaging. Some sensors even change colour depending on the cell cycle: GFP (green) for S, G2, M; then RFP (red) for G1; and both (yellow) when transitioning from G1 to S, allowing for easy visualisation of cell cycle progression. (Sakaue-Sawano et al. 2008).
Antibody labelling
Certain proteins involved in the cycle can be labelled using fluorescent antibodies or detected with Western blots. For example, pH3 is present during mitosis, cyclins and CDK expression varies throughout, and Geminin is present for S and G2 (Eastman et al. 2020).
Synchronization
Most eukaryotic cells divide asynchronously, but large populations of cells can be forced into a particular phase of the cell cycle using synchronization methods. For example, drugs such as lovastatin, aphidicolin and nocodazole halt the cycle at G1, S or M respectively (Eastman et al. 2020), but are often cytotoxic and cause unpredictable cell behavior. Starving the cells of nutrients pushes cells into G0 as many nutrients are needed for division, but stresses cells.
The cell cycle is a dynamic and continuous process, most analysis techniques only observe a single time-point in a single cell. As these cells keep dividing, fluorescent markers are diluted between daughter cells, making it a challenge to study the cell cycle over multiple divisions of the same cell. A robust cell cycle assay would need to study the cell cycle continuously in individual tracked cells over time in a quantitative and high-throughput manner, all in a physiologically relevant context. In addition, live/dead staining should be used to exclude dead/dying cells from analysis. Assays should also allow for the addition of drugs and other test factors to observe the effects on the cycle.
Summary
The cell cycle is how cells divide into daughter cells, a central process for cell proliferation and differentiation to occur. Researchers aim to understand this complex cycle and how it can break down through various assays that label various components of the cycle and can distinguish which cells are at which stage.
References
Eastman, A. E., & Guo, S. (2020). The palette of techniques for cell cycle analysis. FEBS letters, 10.1002/1873-3468.13842. Advance online publication. https://doi.org/10.1002/1873-3468.13842
Sakaue-Sawano, A., Kurokawa, H., Morimura, T., Hanyu, A., Hama, H., Osawa, H., Kashiwagi, S., Fukami, K., Miyata, T., Miyoshi, H., Imamura, T., Ogawa, M., Masai, H., & Miyawaki, A. (2008). Visualizing spatiotemporal dynamics of multicellular cell-cycle progression. Cell, 132(3), 487–498. https://doi.org/10.1016/j.cell.2007.12.033


